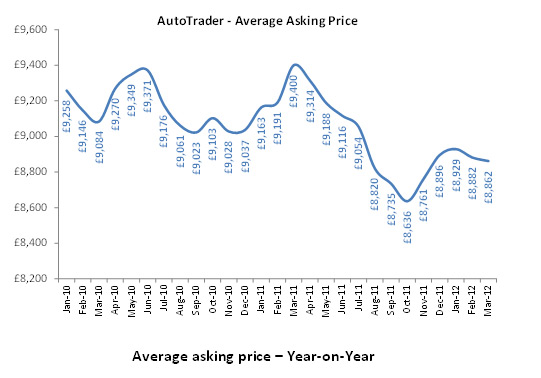
According to a report from the UK’s number one motoring website Autotrader, prices of used cars in the UK have fallen on average 3.9% since January.
The report has been compiled using the Auto Trade Price Index, which takes into account vehicle listing details and asking prices. They have put this reduction down to reduced demand and increased market volumes caused by rising fuel and running costs.
Tim Peake, Group Strategy Director at Auto Trader, said: “Demand overall for both new and used is still subdued, which is why we are seeing an overall decline in used car prices. It seems those that can afford to purchase are making the most of competitive prices being offered by dealers and private sellers. Given the rising fuel prices, now is a good time to consider the total cost of ownership of a vehicle.”
Drivers in London have seen the biggest drop in used values, with a whopping 8.4% wiped off the average asking price according to the website.
Its not all bad news for motorists, Autotrader has tracked prices of used cars less than 3 years old gaining value. The 1% increase (from £14,612 to £14,797) is been put down to lack of available cars in this band as new car registration continue to fall year on year since 2007.
This news comes as recent figures from Society of Motor Manufacturers and Traders (SMMT) show a general slow down in the new car market together with a massive shift to fuel efficient cars. Motorists are opting for low emissions diesel and hybrid cars to cut fuel and road tax costs.

Read more for a full break down including regional data.
[ad]
Average asking price – Year-on-Year
|
Average Asking Price |
YoY % Change |
||
|
Q1 2011 |
Q1 2012 |
||
|
Less than 3 Years Old |
£14,612 |
£14,797 |
1% |
|
3 to 10 Years Old |
£7,121 |
£6,906 |
-3% |
|
10+ Years Old |
£2,532 |
£2,351 |
-7% |
Average asking price – regional data
|
Rank |
Region |
Q1 2011 |
Q1 2012 |
YoY % Change |
|
1 |
Scotland |
£9,738 |
£9,618 |
-1.2% |
|
2 |
Yorkshire |
£9,617 |
£9,434 |
-1.9% |
|
3 |
Northern Ireland |
£9,922 |
£9,428 |
-5.0% |
|
4 |
South East |
£9,860 |
£9,384 |
-4.8% |
|
5 |
London |
£9,837 |
£9,007 |
-8.4% |
|
6 |
West Midlands |
£8,842 |
£8,593 |
-2.8% |
|
7 |
Wales |
£8,661 |
£8,530 |
-1.5% |
|
8 |
East Midlands |
£8,831 |
£8,458 |
-4.2% |
|
9 |
East England |
£8,547 |
£8,434 |
-1.3% |
|
10 |
North West |
£8,714 |
£8,324 |
-4.5% |
|
11 |
North East |
£8,356 |
£8,062 |
-3.5% |
|
12 |
South West |
£8,366 |
£7,975 |
-4.7% |


